
Making Small Samples Work
July 2025
This article is rated:


Small datasets are a reality in evaluation work. Whether you are evaluating pilot interventions with fewer than 10 participants or analyzing survey data with only a handful of responses, working with limited data presents unique analytical and communication challenges.
These challenges include heightened sensitivity to individual responses, vulnerability to outliers, privacy concerns, and the risk of overconfident conclusions. However, small samples often contain valuable insights that the data users need to make informed decisions about their programs.
The key is in understanding the strengths and limitations of small samples, while communicating results with the appropriate context and transparency.
This article explores four critical challenges when working with small samples and provides practical strategies for addressing each challenge.
Challenge #1: Sensitivity to Individual Responses
In small samples, each data point carries disproportionate weight. A single response can significantly alter percentages and shift the entire narrative of your evaluation findings.
Example: Primary Care Exercise Program
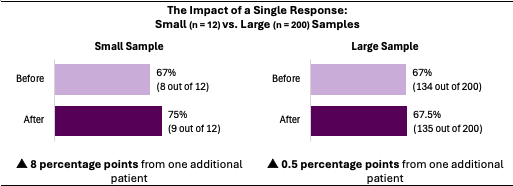
Consider a pilot exercise program for 12 patients with diabetes. After the first month, eight patients were consistently meeting their weekly exercise goals, resulting in a 67% success rate (8 out of 12 patients). Three months later, one additional patient began meeting their goals resulting in a 75% success rate (9 out of 12 patients). A single patient created an eight-percentage-point increase, making the exercise program appear significantly more effective when the change represented one person's progress.
Compare this to a full-scale program with 200 patients with diabetes. Starting with the same 67% success rate (134 out of 200 patients), adding one additional successful patient would increase the rate to only 67.5% (135 out of 200 patients). The same individual improvement that resulted in a significant percentage change in the small sample (n=12) creates minimal change in the larger sample (n=200).
Strategies for Managing Sensitivity to Individual Responses
Transparency is your primary tool for managing sensitivity to individual responses. When your data users understand the scale behind percentages, they can better interpret the findings.
Present raw numbers with percentages: Report "75% satisfaction (9 out of 12 patients)" rather than just "75% satisfaction".
Explicitly state sample sizes: Include sample sizes in all charts, tables, and summary statements.
Explain the impact of individual responses: Help data users understand how single responses affect results (e.g., Achievement of goals increased from 67% to 75% because of one additional person reaching their goal).
Use visual representations that emphasize scale: Choose charts that show actual data points or use annotations that highlight the small sample size.
Consider confidence intervals: Show confidence intervals to illustrate the uncertainty around your estimates. For broader audiences, consider using accessible language like 'this estimate could vary by ±X points' to convey uncertainty.
Challenge #2: Vulnerability to Outliers
Small samples are particularly susceptible to outliers that can disproportionately affect results and lead to misleading conclusions. What might be a minor variation in a large dataset becomes a major distortion in a small sample.
Example: Mental Health Crisis Response
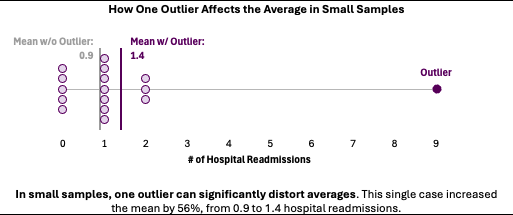
Consider evaluating a new crisis intervention program serving 16 individuals experiencing severe mental health episodes. Most participants showed improved stability with hospital readmission rates decreasing significantly. However, one participant experienced multiple crisis episodes due to medication non-compliance unrelated to the program, requiring nine emergency interventions.
This single outlier case dramatically increases the average number of crisis episodes post-intervention and could make the program appear ineffective, despite positive outcomes for 15 of 16 participants.
Strategies for Handling Outliers
Rather than simply excluding outliers, investigate outliers to understand what they represent and how they influence your interpretation of the data.
Report multiple measures of central tendency: Present mean, median, and range to give a complete picture of your data distribution, as outliers can significantly affect some measures, (particularly means) while leaving others unchanged.
Display the full distribution: Use visualizations (e.g., dot plots, bee swarm plots) that show all individual data points, not just summary statistics.
Investigate outliers systematically: Document why outliers occurred and whether they represent program failures, external factors, or measurement issues.
Report findings with and without outliers: When outliers significantly impact results, show both scenarios with clear explanations.
Contextualize outlier cases: Provide narrative explanation of outlier circumstances without compromising privacy.
Challenge #3: Heightened Privacy Concerns
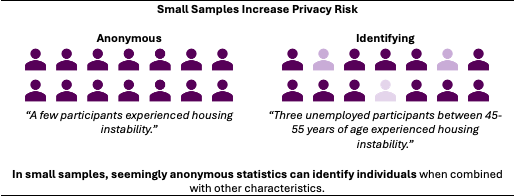
Small sample sizes create privacy risks that are less prominent in large datasets. When reporting on hundreds of participants, individual identities disappear into aggregate statistics. However, with small samples, participants can become identifiable through seemingly anonymous data.
Example: Substance Use Treatment Program
A substance use treatment program in a rural community provides medication-assisted treatment to 14 individuals. The evaluation report states that 'three participants experienced housing instability during treatment' and later notes that 'participants aged 45-55 were more likely to face employment challenges.' In a small town where community members know who's receiving substance use treatment, combining this seemingly anonymous information could identify specific individuals. What appears to be appropriately aggregated data becomes personally identifiable when the sample size is small and the community context is known.
Strategies for Privacy Protection
Privacy protection in small samples requires proactive planning and conservative reporting.
Establish minimum reporting thresholds: Set rules such as "don't report subgroups smaller than 5" or "combine categories when individual subgroups are too small".
Use broader categorical reporting: Replace specific numbers with ranges or qualitative descriptions: "most participants" instead of "11 out of 13 participants".
Aggregate across time periods or cohorts: When possible, combine data from multiple small cohorts to increase anonymity.
Focus on thematic rather than statistical findings: Emphasize patterns and themes rather than precise statistics for sensitive topics.
Obtain explicit consent for detailed reporting: Discuss with participants what level of detail will be reported and obtain specific consent.
Challenge #4: Overconfidence in Results
Perhaps the most dangerous pitfall of small samples is the tendency toward overconfidence in results. Small datasets can produce seemingly impressive findings that appear more definitive than they are.
Example: Homeless Services Navigation Program
A pilot program helping individuals navigate homelessness services shows strong results: 11 out of 12 participants (92%) successfully obtained stable housing within 90 days. This success rate appears to provide strong evidence for program effectiveness.
However, the 92% represents only 11 people. Such strong, positive results in a small sample may indicate genuine program effectiveness or other favourable conditions. Participants may have been selected because they were already housing-ready, or external factors like increased housing availability may have contributed to the high success rate. The small sample size makes it difficult to determine whether these results would replicate with future participants.
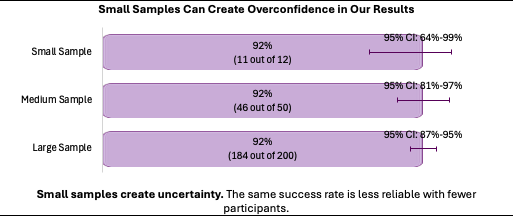
*CI = Confidence Interval, which represents the range in which the true value is likely to fall. Smaller (narrower) confidence intervals indicate greater precision in the estimate.
Strategies for Addressing Overconfidence
Maintaining appropriate skepticism about small sample results protects both your credibility as an evaluator and the data users' decision-making.
Question unusually high success rates: When results seem "too good to be true," investigate potential sampling bias, measurement issues, or external factors that might inflate success.
Acknowledge limitations explicitly: Be transparent about what your small sample can and cannot tell you about program effectiveness.
Resist pressure for definitive claims: If you are pushed for conclusive statements, remind the data users that small samples provide preliminary insights, not definitive proof.
Consider comparison groups carefully: Small samples make it difficult to establish comparison groups, so be cautious about causal claims.
Report confidence intervals when possible: Show the range of uncertainty around your estimates to illustrate the precision (or lack thereof) in your findings.
The Value of Small Numbers
Small samples are not inferior datasets. They provide valuable information that require different analytical and communication approaches. By acknowledging the limitations of small samples and highlighting their strengths, you can provide your data users with honest, useful information for decision making.
Your goal is not to make small numbers seem larger, but to tell their story accurately and completely. By being transparent about sample sizes, careful about interpretation, and thoughtful about privacy, small samples can provide the important evidence required for program improvement.
Remember that in evaluation work, small numbers often represent the reality of service delivery. Learning to work with them effectively is essential for ethical, practical evaluation practice.